UPD’s Theory of Performance Management

Posted in Stat with tags , on September 22, 2014 by updconsulting

Performance Management seems to be one of the new buzz words in the market place.  A lot of this has been driven by the US Department of Education leveraging “Performance Management” as a means for sustaining many of the reforms initially implemented through Race to the Top.  And even more broadly, performance management is seen as a way to drive results to ensure that we see outcomes.

So what exactly is performance management?  It is “a process that methodically and routinely, monitors the connection, or lack thereof, between the work that we are doing, and the goals we seek… A process that compares what is to what ought to be.”

So let’s take a moment to reflect? The latter point of comparing what it is to what it ought to be is probably what most people think of when they think of performance management.  As long as they consistently ask themselves “Did we do what we said we were going to do?” and as long as they do this on some type of regular basis they consider this to be a successful performance management process.

Our area of expertise is in implementation.  But the problems that we look to address are most often adaptive problems rather than technical problems.[1]  Heifetz describes technical problems as issues that have a clear resolution path (i.e. fixing a broken leg), and adaptive problems where we are not clear on how to solve a problem and may need to try multiple strategies to attempt to solve the problem (i.e. fixing Obamacare).

Kasel's Blog Post

So then what is the difference between Performance Management and Stat?  Well Stat is our (UPD’s) implementation of Performance Management. It allows us to measure the progress of our work in an adaptive manner.  UPD’s Stat model has been proven to be an effective way of implementing Performance Management.

[1] http://www.youtube.com/watch?v=UwWylIUIvmo

Leveraging LEA Wisdom + Effective SEA Communication = Increased Likelihood of Implementation Success

Posted in Uncategorized on September 19, 2014 by updconsulting

Over the past three years, UPD has helped two state education agencies  (SEAs) develop and implement their Local Education Agency’s (LEA) performance management processes to support effective implementation of their Race to the Top initiatives. In a nutshell, these processes involved the facilitation of ongoing, structured meetings attended by LEA leadership team members during which participants actively engaged with teams from other districts around challenging problems of practice and promising strategies for addressing these challenges.


Rhode Island and Illinois, the SEAs that implemented these processes with support from UPD, both deliberately incorporated LEA input into their planning and continuous improvement efforts. Through the strategic use of online surveys, appointing an LEA advisory group, and diligently gathering and analyzing feedback after every meeting, both states ensured that not only were the sessions helpful to LEAs but that participants felt ownership over the work and saw the SEA as better partners than in past implementation efforts.

Elaine's blog post

Having an LEA focus truly means that the meeting discussions are LEA-centric and focused on what the LEAs need, rather than on what the SEA thinks should be discussed. When this happens, the conversations provide LEA and SEA participants with rich and often unexpected insights into implementation successes and challenges. Session facilitators can promote an LEA focus by asking open-ended questions about lessons learned and challenges facing the districts in their groups, and reinforcing the practice of LEA teams deliberately asking and answering questions of teams from different LEAs, rather than turning to the SEA representatives in the room for answers.


Building positive relationships with LEA stakeholders does not happen overnight. People often have to move past previous experiences where the SEA and LEAs were not aligned regarding expectations for implementation which led to low levels of trust between LEAs and the SEA. Transparent communication by SEAs is critical in reinforcing a positive partnership with LEAs.


SEAs can build trust by continuously providing timely turnaround on the sharing of lessons learned and resources, and by clearly and regularly articulating, “Here is what you told us, and this is what we did because of your input.” Even when there is not an obvious or immediate solution, it is an opportunity to practice transparent and deliberate communication and further build trust with LEAs.


En fin de compte (as my high school French teacher was fond of saying and which translates to “In the final analysis…” in English), SEAs that:

  1. deliberately engage LEAs in process and content design,
  2. respond clearly and consistently to LEA suggestions and questions, and
  3. provide meaningful opportunities for LEA teams to share their challenges and strategies,

will see increased LEA ownership of implementation success, improved relationships with LEAs and a greater understanding of “on-the-ground” implementation challenges and effective strategies.


More information on this issue is forthcoming in a Brief authored by UPD for the US Department of Education’s Reform Support Network. Details and a link coming soon!


Written by Elaine Farber Budish, a Senior Consultant at UPD Consulting (elaine@updconsulting.com), September  2014

SLOs: When the O stands for Opportunity Some Advice for LEA/SEA Leaders

Posted in Uncategorized on July 24, 2014 by updconsulting

Student Learning Objectives (also known as SLOs, Student Growth Targets, and other aliases) are gaining momentum nationally as one measure being implemented by states and districts within their new educator evaluation systems. Briefly, SLOs are long term, measurable academic goals that teachers (and administrators) set for students.

While many states and districts are implementing SLOs, there are also big concerns about SLOs: How do we make them valid and reliable? What assessments can be used to measure student progress, especially in subjects like art, music, foreign languages, and physical education? Do SLOs really mean more testing? What is a year’s worth of growth, anyway?

SLOs ask hard questions of educators; questions that states and districts are often unprepared to answer. Instead of retreating to easy answers that emphasize compliance from educators, stop and think about the opportunity created by the need to grapple with and implement SLOs. Based on UPD’s experience in supporting SEAs and LEAs in the work of designing, implementing, and managing SLOs, there are some golden opportunities for reform that can be missed if leaders aren’t thinking in the right ways:

•Growth is a complicated puzzle: Yes, SLOs are designed to measure growth. But do all your teachers and administrators agree on what equates to a year’s worth of growth? Given where a student starts the year, what can educators reasonably expect in terms of improvement over the course of a year? Do educators know their content well enough to be able to envision the skills and content for their class stretched along a scale and spanning the timeline of the instructional interval, whereby they can measure student growth? Given the difficult implementation of Common Core, probably not. These questions, which are central to our role as educators, present an opportunity to think about new content standards and how both teachers and students interact with those standards in different ways.

•Student target setting is key: Yes, SEAs and LEAs ask teachers to set growth targets for their students based on historical and baseline data, which can feel like another task on a teacher’s endless to-do list. However, any push towards individualized instructional planning and delivery is a good one. The target setting process requires that teachers think through each of their students at the beginning of every year, including where he/she has been academically, and where he/she needs to go next in their learning. The implications for that kind of work reach far beyond teacher evaluation. Between having to dive deeply into new curriculum and planning to facilitate individual students’ growth, this is an opportunity to significantly impact student learning.

•Don’t let (a lack of) assessments derail you: Part of the difficulty of implementing SLOs is deciding which assessments teachers can use to document student growth. Leadership will spend a lot of time worrying about what tests can be considered valid and reliable, and how to deal with core subject areas versus art, music, physical education, and other subjects that do not traditionally make use of standardized assessments. A ready-made answer might be to simply buy assessment systems to cover all grades and subjects, but this would mean missing the opportunity. Stop. Do not pass go. Leaders, go back to the table, pull in your best teachers and look for innovative assessment practices in your schools. Don’t spend money on new assessments in the very year state assessments are changing. Don’t make teachers feel that tests are the only way to measure student growth. Do the hard work of bringing educators together and start defining performance standards. Think of this as the opportunity to do really meaningful professional development on new standards by asking teachers to engage and figure out together what assessments, rubrics, performance tasks and projects make the most sense and provide multiple and diverse ways to document student growth.

•And again (in case you weren’t paying attention), engage educators: teacher evaluation is a controversial subject for obvious reasons. Put your money where your mouth is when you say that these systems are about designing supports for teachers and creating opportunities for teacher leadership. Bring teachers and administrators together from around your LEA/SEA and have them collaborate on the very tough questions SLOs raise. They are not tough because they are related to evaluation, they are tough because they raise fundamental issues in education reform and in teacher practice, and there are no easy answers. Value the collaboration and the process over finding The. Right. Answer. If there were one right answer, everyone would be doing it. There isn’t one – free yourself from trying to find it.

The minute SLOs become a compliance exercise (whether it’s compliance from teachers in following district guidance or compliance from LEAs in following SEA policy), the opportunity to think and collaborate and push our own practice has been lost. Grab the opportunity SLOs provide and make the most of it.

Written by Laura Weeldreyer, a consultant at UPD Consulting
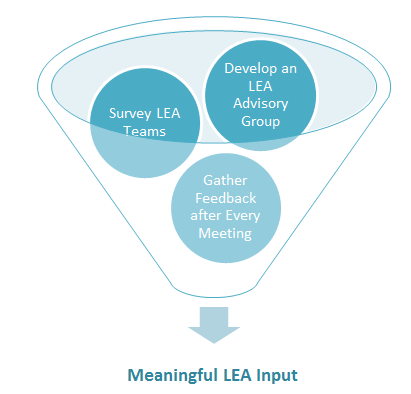
Taking a Closer Look at Value Added

Posted in Human Capital Management, Teacher Evaluation System, Uncategorized, Value-added and growth models with tags , , on June 20, 2014 by updconsulting

random-numbers_19-136890-266x300Last month I joined a team of UPD-ers and traveled around the state of Oklahoma training district-level trainers on Value-Added.  During one of the sessions, a participant raised his hand and asked our team how value added could be relied upon as a valid measure of teacher effectiveness when districts like Houston Independent School District[1] are currently involved in lawsuits surrounding the legitimacy of their value-added model, and the American Statistical Association (ASA) released a statement[2] that has been described as “slamming the high-stakes ‘value-added method’ (VAM) of evaluating teachers.”    Although we were familiar with both the Houston lawsuits and the ASA statement, this question created an opportunity to take a closer look at recent articles and information opposing (or seeming to oppose) value added.


First, a little background:  According to our partners at Mathematica Policy Research, “Value-added methods (sometimes described as student growth models) measure school and teacher effectiveness as the contribution of a school or teacher to students’ academic growth. The methods account for students’ prior achievement levels and other background characteristics.”  Value added does this via a statistical model that is based on educational data from the given state or district, and uses standardized test scores to evaluate teachers’ contribution to student achievement. Although value added and similar measures of student growth had been used in various places in the United States without much opposition, criticism peaked around 2010 when districts such as Chicago, New York City and Washington, DC began incorporating value-added into high-stakes teacher evaluation models.  Since then various individuals and organizations have published their views on the merits or pitfalls of value added including, most recently, the American Statistical Association (ASA).


The ASA statement has garnered considerable attention because as described by Sean McComb, 2014 National Teacher of the Year, “… I thought that they are experts in statistics far more than I am. So I thought there was some wisdom in their perspective on the matter.”[3] Of course as statistical experts they shed some light on what can and cannot reasonably be expected from the use of value-added measures, but here are a few ways that we can address parts of their statement that may be misunderstood:

  • The ASA mentions that value added models “are complex statistical models, and high-level statistical expertise is needed to develop the models and interpret their results. Estimates from VAMs should always be accompanied by measures of precision and a discussion of the assumptions and possible limitations of the model.”  Although it is true that the models themselves are complex and require advanced statistical expertise to compute, we would argue that people without this level of expertise can be trained on the concepts behind how the models work and also how results should be interpreted.  In Oklahoma, part of the training we provide is designed to help teachers build a conceptual understanding of the statistics behind value added.  Although we do not look at the regression formula itself, we help to define components of the measure including how it is developed, its precision, etc. so that teachers are able to better understand how value added can provide additional data to help inform their instruction.
  • In the report, the ASA cautions that since value added is based on standardized test scores, and other student outcomes are predicted only to the extent that they correlate with test scores, it does not adequately capture all aspects of a teachers effectiveness – “A teacher’s efforts to encourage students’ creativity or help colleagues improve their instruction, for example, are not explicitly recognized in VAMs.”  This statement is true and it is one that we are quick to highlight when we train on value added.  Value-added models are not designed to measure teacher effectiveness in isolation as they only tell part of the story.  When used as part of an evaluation system with multiple measures (such as classroom observations and student surveys), a more complete and stable picture becomes available.
  • Finally the ASA clearly states that “VAM scores are calculated using a statistical model, and all estimates have standard errors. VAM scores should always be reported with associated measures of their precision, as well as discussion of possible sources of biases.”[4] Since we are always transparent about the fact that all value-added estimates have confidences intervals, this is almost always something that trips people up during training sessions.  Many will say, “If there is a margin of error, then how can this measure be trusted enough to include in an educator evaluation system?”   What is easy to forget is that all measures, statistical or not, come with some level of uncertainty.  This includes more traditional methods of teacher evaluation such as classroom observations.  Although efforts should be made to limit or decrease the margin of error where possible, there will never be a way to completely eliminate all error from something as wide and deep as teacher effectiveness. Despite this, this does not mean that value added should not be used to evaluate teachers but, as mentioned previously, it should be considered alongside other measures.


By Titilola Williams-Davies., a consultant at UPD Consulting.


[1]Strauss, Valerie. April 30, 2014. ”Houston teachers’ lawsuit against the Houston Independent School District” Washington Post. http://apps.washingtonpost.com/g/documents/local/houston-teachers-lawsuit-against-the-houston-independent-school-district/967/


[2]American Statistical Association. April 8, 2014. “ASA Statement on Using Value-Added Models for Educational Assessment.” http://www.amstat.org/policy/pdfs/ASA_VAM_Statement.pdf


[3] Valerie Strauss. April 30, 2014. “2014 National Teacher of the Year: Let’s stop scapegoating teachers” Washington Post. http://www.washingtonpost.com/blogs/answer-sheet/wp/2014/04/30/2014-national-teacher-of-the-year-lets-stop-scapegoating-teachers/?tid=up_next


[4] American Statistical Association. April 8, 2014. “ASA Statement on Using Value-Added Models for Educational Assessment.” http://www.amstat.org/policy/pdfs/ASA_VAM_Statement.pdf


Teacher Evaluation and the Burden of Evidence

Posted in Uncategorized on June 11, 2014 by updconsulting

Over the last several years, school districts across the country have been rolling out more rigorous and detailed evaluation rubrics along with systems to help administrators and teachers collaborate, collect evidence, and share performance ratings. If your school district (or school district that you are consulting for) is adopting a new teacher evaluation system to aid with collecting quality evidence, I have a single piece of advice for you. But you have to read to the end to get it.

The new evaluation frameworks are significantly more complex than the evaluation practices they have replaced. The Danielson framework, for example, contains 22 potential components. These are containers or categories for what is commonly referred to as “evidence,” typically taken in the form of notes by administrators. In some school districts as many as 10 of these 22 components need to be captured during a single class period teacher observation. At the end of the day, in districts that have already rolled out new rubrics, the burden of evidence to support those rubrics falls heavily on the administrators.

Now, I want to magically transport you and your laptop to the back of a classroom where it is your job to capture all applicable evidence for a complicated new framework, that has just been introduced to you, while the teacher works through the ebbs and flows of a lesson and the students fire off questions. Ready, set, go! The teacher begins the lesson and you have become the equivalent of a court reporter. How good are your shorthand typing skills? How dependable is your wi-fi? Can you really type up quality evidence and organize it on the spot, using new technology?


 ImagePhoto by Julia Kuo

From my experience having personally trained hundreds of Principals and Assistant Principals on teacher evaluation tools, this may be the single most valuable lesson I’ve learned: How can you change years, or even decades, of note-taking habits over the course of a few hours and show administrators how to collect evidence in an entirely different way? Easy answer: you don’t.

If you are going to roll out detailed rubrics and build sophisticated systems to capture the evidence, that is just swell. But when it comes to actually capturing the notes in the classroom session, I urge you to empower the administrators to use their preferred methods of colleting notes, whatever those methods may be. Spreadsheet? Sure. Word processing? Of course. Pen and paper? Knock yourself out (though you will have to type it up later). The important thing is that the administrator is comfortable enough to capture notes quickly and this ensures that they aren’t missing valuable evidence while they try to tango with your new system or their potentially lousy wi-fi connection. The frameworks have likely changed, so I don’t mean to imply that the quality and content of notes captured by the administrator don’t have to change: they do. What I am proposing is that you don’t handicap them with a single tool in the fast-paced environment of classroom observation.

You can and should design a system this way. We have done such a thing with Truenorthlogic, who has rolled out their software to some of the largest school districts in the country. Evidence can be copied and pasted from multiple sources. Splitting up the evidence and grouping it by the rubric is incredibly flexible and doesn’t have to be done on the spot in the classroom.

When we piloted the teacher evaluation system at the Chicago Public Schools, we first proposed that administrators replace their previous evidence collection entirely and fire up their laptops and tablets to collect evidence directly in the new system. This did not go over nearly as well as our adjusted approach in the district-wide rollout, where we adopted the “take notes however you like” approach. By then, we had learned that administrators need to be empowered to collect evidence using their preferred method. We need their brain power focused primarily on capturing quality, relevant evidence to their new framework, not on navigating new technology. As long as they can turn around and input that evidence in the system efficiently and share it with the teacher by the required deadline, more power to them. Everyone wins.


By Frank Nichols. Frank Nichols is a Consultant at UPD Consulting.

inBloom, Train Wrecks, and Ed-Fi

Posted in Data Systems, Stat with tags , , , , , , , on May 16, 2014 by updconsulting

IMG_0794

As I sat down to write this entry, my day was interrupted most unusually.  Doug texted me the picture to the left.  The caption said simply, “Say hello to 26th street and the railroad track.”  In the picture I saw the same view I see every work morning from the “Big Table” here at UPD where many of us sit.  After more than 4 inches of rain over 36 hours, the ground right outside our office gave way taking more than a dozen cars and half the street with it.  If you watch the video (found below) of the ground as it collapses underneath the cars, you will see that it left the wall with nothing to hold, and fell under its own weight.  The stories on the news have since revealed that the neighborhood has know this was a problem for years, but their complaints and concerns met a deaf ear in the city and with the rail company.


It’s hard to see such a calamity and think not metaphorically about my originally intended subject: the collapse of inBloom. inBloom was, in lieu of a more boring technical description, a cloud based data integration technology, that would enable districts and states to connect their data to an “app store” of programs and dashboards that could sit on top.  The vision was a seamless and less expensive way for teachers and principals to gain easy access to data about their students.


inBloom was a very big deal.  Started in 2011, several big funders and education heavies devoted their credibility and more than $100 million to try to make it successful.  Their efforts succeeded in garnering several state and district partners.  But since its inception, consumer groups, parents, and privacy advocates have worried that placing their students data in the hands of a third party would not be safe.  Or worse, inBloom might “sell” their student’s data to the highest bidder.  Then came Edward Snowden, and what was a niche news story went prime time.


If you look at the technology within inBloom that transfers and stores data in the cloud, the critics did not have much of a leg to stand on. inBloom’s data protection technology is as good or better than just about any existing state or district.  If you look at inBloom’s license agreement, parents and privacy advocates had more explicit protections than they have now with many student data systems.  What caused inBloom to collapse as quickly as the wall outside my window was more fundamental: trust.  As citizens, we trust districts and states with our students’ data.  And for all of inBloom’s technical explanations on the security of the data, they never made the case that we could trust them as an organization.  With the withdrawal of Louisiana, New York, Colorado, and several districts, nothing could hold inBloom up.


Over the past year at UPD, we’ve done a lot of work with the Ed-Fi data integration and dashboard suite.  We successfully rolled out the system for the entire State of South Carolina in about nine months (public dashboards here) and are very excited to start work with the Cleveland Metropolitan Public Schools to implement Ed-fi there.  Ed-Fi is very different than inBloom, even though they both utilize the same underlying data model.  Based on extensive research on what teachers and principals say they need, Ed-Fi provides a set of powerful data integration and dashboard tools that a district or state can download for free.  Rather than shooting data up into the cloud, Ed-Fi lives where most people already trust, in the data centers of the district or states.  19 states and more than 7,000 districts have licensed Ed-Fi.


The tragedy of inBloom is that it was a great idea ahead of its time and stood to do a lot of good in education.  But the protectors of the status quo should see no victory in its collapse.  Teachers and principals are clamoring for better information to help their students.  Ed-Fi seems ready to pick up where inBloom left off, and do so with the trust this work requires.

———————————

This blog was written by Bryan Richardson. Bryan is a Partner at UPD Consulting and brings over thirteen years of experience in private and public sector management. Bryan holds national expertise in performance management, data systems, and complex project implementation. 

Asking the Right Questions—Data Privacy and Security

Posted in Data Systems, Stat with tags , , , , , , , on May 12, 2014 by updconsulting

There are a lot of good signs to be seen in recent news about security and privacy in the education technology sector. Some of the key questions being asked by educators and administrators are “how well are student data protected from prying eyes and greedy corporations?” and “who has access and how are the data being used?” These are good questions, and they represent the vestiges of our struggles with adopting modern technology over the past 15 years. Conversations have matured from simple arguments around the value of computers in every classroom to philosophical debates about our organizations’ embrace of performance data as the ombudsman of quality education. Progress has clearly been made, but in our rush to catch-up with our corporate cousins we missed asking what turns out to be a pretty important question–who owns all this stuff?


That’s the question that ultimately sealed the fate of inBloom, a non-profit offering a cloud-based data warehouse designed to help districts and vendors share student information. Despite funding from big foundation names like Gates and Carnegie, inBloom collapsed under the weight of a five word question they were never able to answer well enough to satisfy concerned stakeholders. If data are stored on a machine that is not physically located in a building owned by the district, who really owns the data?

data privacy

The data issue is really a matter of security and access, which isn’t so different from the days of paper records in filing cabinets–information was kept in a secure, locked location and only certain people had access. With data warehouses replacing filing cabinets, the difference is that the information is stored off-site and the keys are also in the hands of the data warehouse manager (in other words, the system or database administrator). inBloom failed to effectively communicate this subtle difference early on, and any answer they eventually provided came across as reactionary, slick, dishonest, and–my favorite new term–“hand-wavy.”


Schools and districts aren’t used to asking those questions, and the education technology sector isn’t used to answering them. This disconnect doomed the effort from the beginning. Had the question “who owns this stuff?” been asked early on, the answer would have at least brokered a conversation rather than distrust and eventual dismissal–not to mention a waste of about $100 million dollars in grant funding.


Ideally, that conversation would lead to a compromise where information storage and archiving solutions satisfy the security and access needs of all players–parents, teachers, administrators, and the general public. Perhaps the right solution keeps an element of the status quo: secure data such as individual names, contact information, and other personally identifiable information could be stored on-site with the keys in the hands of the same people, but the bulk of the data could be stored in the cloud. Hybrid solutions like this are possible with dashboard software like Ed-Fi where the software itself can be installed on-site along with the secure data and set up to pull the remainder of the data from the cloud.


In the consulting world at UPD, we see those disconnect problems all the time: Group A spends a ton of time and money solving a problem for Group B without ever truly engaging the members of Group B. inBloom undoubtedly engaged their stakeholders in the early stages, but not deep enough to where someone was able to ask “who owns all this stuff?” This is often the result of too much focus on delivering a solution and providing answers rather than asking questions and identifying the problem. It comes with the territory–we get so excited about the possibilities of new technology that we jump right into requirements gathering without stopping to think if we’re asking the right questions and solving the right problem. It might just be as simple as an issue of maturity; if we’re getting serious about our relationship with technology, it’s probably time we start asking about intentions.

———————————

This blog was written by Andrew Keller. Andrew is a Consultant at UPD Consulting and brings over 10 years of experience in education, policy, and data metrics.  

Literary Lots: Sponsorship Interview

Posted in Economic Development, Management Consulting, Uncategorized with tags , , , , , , , , , , on July 24, 2013 by updconsulting

Literary Lots, Kauser Razvi’s community revitalization project funded through Kickstarter, is a program that helps urban neighborhoods whip vacant lots into shape by transforming vacant lots into summer program spots for children. In Cleveland, several lots will take on literary themes from children’s books and spend the summer months as spaces for art and education. Working with Cleveland Public Libraries and LAND Studio, Literary Lots will transform 2 to 4 vacant lots adjacent to libraries into six-week summer program spots for children in inner-city Cleveland.

Between June and August 2013, local artists will use themes from specific children’s books to re-create places, concepts, or adventures from the book, creating a magical and educational space to engage local youth in art and culture.  The lots will be filled with books (naturally), and will feature reading and writing classes, in addition to providing interactive games for kids.  The hope is these spaces will bring neighborhoods, cultural institutions and artists together in creative collaboration to bring books to life… and keep books in our children’s lives.

UPD, a sponsor, was interviewed about our interest in the project. You can read Doug Austin’s, UPD President and CEO, interview here.

———————————

Kauser Razvi, an Account Executive at UPD, brings over 14 years of public sector management experience to the team. Her consulting engagements have included the organizing community members, funders, and businesses around the establishment of Global Cleveland, developing long term project plans for the Chicago Out of School Time project funded by the Wallace Foundation and the development of technical and organizational strategies around data systems to improve business functions and operations in Government and non-profit organizations. She holds a BA in Sociology and BS in Journalism from Boston University and a Masters in Urban Planning from the University of Michigan.

Congratulations NCTQ on your Teacher Prep Review in US News and World Report!

Posted in Human Capital Management, Performance Measurement, Stat, Teacher Evaluation System with tags , , , , , , on June 18, 2013 by updconsulting

Hopefully on your drive to work today, you heard NPR’s story on the Teacher Prep Review just released by the National Council on Teacher Quality.  US News and World Report will publish the results in their next issue. Just like US World’s college and grad school rankings, this study rates how well our nation’s educator prep programs prepare teachers for the 21st century classroom.

UPD supported NCTQ in this project by helping them develop RevStat, a performance management process to stay on track and continuously monitor the quality of their analysis. You can read the report here and learn more about UPD’s stat process here. (BR)

Reinventing The Wheel

Posted in Management Consulting, Uncategorized with tags , , , , , on May 21, 2013 by updconsulting

For years, many cities have undertaken the task of developing a citywide plan, agenda, goals, etc. around children and youth development and success.  In most cases, this work is a collaboration between multiple organizations, including the school district, city agencies (parks and recreation, libraries), city funded agencies and community based nonprofits.  While the core values that these organizations have around youth success are common, bringing these organizations together to discuss and arrive at a common mission and set of goals, objectives, standards, and measures to work towards can take years to accomplish.  Examples of this type of work are the Nashville Children and Youth Master Plan, Milwaukee Succeeds, Grand Rapids Youth Master Plan, Minneapolis Youth Coordinating Board, Chicago Out-of-School Time Project, Ready by 21 Austin, among many others.  Even more examples are included here, on the National League of Cities site.

A sampling of some of these plans is included in a table below.  Even doing a quick scan of these initiatives reveals many common threads in the goals and objectives that were the result of the months/years of collaborative work: youth/children are prepared for school, succeed academically, are healthy, are supported by caring adults, and contribute to the community.

In a recent conversation I had in discussing how to start this type of work, the question was raised “why don’t we just use what has already been done?”  So why spend years redoing the work when it has already been done?

Reinvent the wheelto waste time trying to develop products or systems that you think are original when in fact they have already been done beforeCambridge Idioms Dictionary, 2nd ed. Copyright © Cambridge University Press 2006

The reason for spending the time, effort and resources is because the participation in this type of process is as important or more important than the output.  Bringing together leaders across the city who may or may not have worked well together in the past to discuss not only their own organizations, but also how as a city they can work towards a common set of goals and objectives is incredibly powerful.  Building these relationships and knowledge about each other’s work should increase the chances of success in work towards the common goals.

Even though there is a lot in common with the outputs (master plan, goals/objectives) from each of these efforts, they also each have a unique aspect to them.  Each of the efforts involved a unique set of people and organizations who have their own perspectives about priorities in their city and communities.  These citywide plans and goals are something that (hopefully) these organizations will be working together on for a long time to come, so it should be something that they each feel a connection with – something that they helped create.

Of course, this does not mean that efforts like this should happen in isolation, when there are clearly good examples of what worked well (and what didn’t work well) in the past.  So, these type of resources should be utilized to learn from, but not for the purpose of cutting out any of the important work in the development of the end product.

At the same time “reinventing the wheel” is an important tool in the instruction of complex ideas. Rather than providing students simply with a list of known facts and techniques and expecting them to incorporate these ideas perfectly and rapidly, the instructor instead will build up the material anew, leaving the student to work out those key steps which embody the reasoning characteristic of the field.”

Questions like this continually come up in the work we do.  Why spend months developing a particular school district process with participation from unions, principals, teachers, parents, etc. when there are good examples that have already been developed using this same type of process in other districts?  Why hold another community meeting or  focus group session if you think you already know what people think about a particular topic?  Because the process of “inventing” is as important as the “invention.”


This blog was written by Cari Reddick. Cari is a Project Manager at UPD Consulting and has over 12 years of project management experience.


Samples of Citywide Youth Master Plans

Nashville Milwaukee Grand Rapids Minneapolis
All children and youth will have a safe and stable home and a supportive, engaged family. All children are prepared to enter school Early childhood development, life-long learning & education All Minneapolis children enter kindergarten ready to learn
All children and youth will have safe places in the community, where they are welcomed and supported by positive adult relationships All children succeed academically and graduate prepared for meaningful work and/or college Employment & financial independence All Minneapolis children and youth succeed in school
All children and youth will develop valuable life skills, social competencies, positive values and become law abiding, productive citizens All young people utilize post secondary education or training to advance their opportunities beyond high school and prepare for a successful career Basic, physical & psychological needs All Minneapolis young people have access to quality out-of-school opportunities
All children and youth will have confidence in themselves and in their future Recognizing the difficult economic realities facing our families, all children and young people are healthy, supported socially and emotionally, and contribute responsibly to the success of the Milwaukee community Mentoring, afterschool, cultural activities & strategic planning All Minneapolis children and youth people have opportunities to prepare themselves for the responsibilities of an active civic live
All children and youth will have opportunities to have their voice heard and positively impact their community Civic engagement, training & leadership
All children and youth will experience social equity regarding access to opportunities, resources and information that are critical to their success in the 21st century
All children and youth will experience a safe and caring school environment that supports social, emotional and academic development
All children and youth will achieve academically through high quality, engaging educational opportunities that address the strengths and needs of the individual
All children and youth will be physically healthy
All children and youth will learn and practice healthy habits and have access to the resources that support these habits
All children and youth will be mentally healthy and emotionally well
All children and youth will have access to and participate in quality programs during out-of school-time
All children and youth will have safe outdoor spaces in their neighborhood that provide opportunities for play and recreational activities
All children and youth will have safe transportation options that allow them to engage in activities, and access services and supports that the community has to offer